Charter & Ledger

Procurement Cost Analysis Report Guide

How to read your Procurement Cost Analysis

This guide explains what the report contains, how each section works, and what to do with the findings.

Looking for the quote normalization guide? Read the quote analysis guide →

On this page

  1. 1. What this report shows
  2. 2. The Executive Brief
  3. 3. Priority Actions
  4. 4. Material Cards
  5. 5. How savings are calculated
  6. 6. What to do next

1. What this report shows

The Procurement Cost Analysis report analyzes 12 months of your actual purchase order and invoice history (not vendor quotes) to show you how your material prices have moved over time, where you may be overpaying, and what actions are worth taking before your next purchasing cycle.

The report covers the materials that make up the largest portion of your ingredient spend. For each one, it shows volume patterns, price trends, and a specific recommendation on what to do next.

This report is based on your actual purchasing history. The findings reflect what you have paid and how your volume has moved, not a general market forecast. The recommendations are specific to your situation.

2. The Executive Brief

The top-level summary at the start of the report

The Executive Brief appears at the top of the report and shows two things: a savings opportunity range and a breakdown by material.
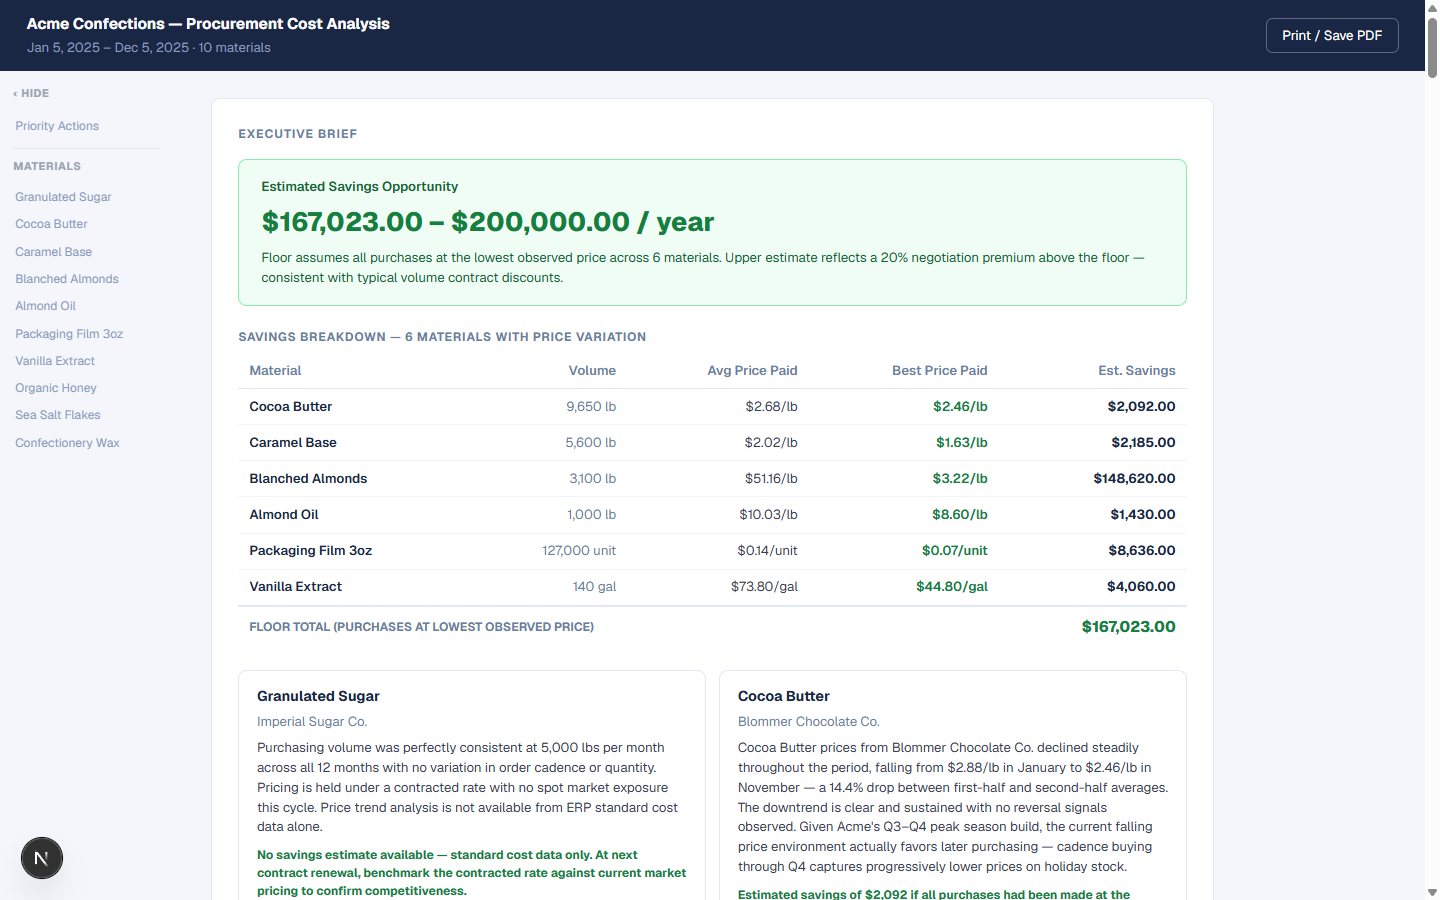
Executive Brief with savings opportunity and materials breakdown table
The Executive Brief shows the estimated savings range and a per-material summary.
Savings opportunityThe floor estimate assumes all purchases had been made at the lowest observed price across materials with transactional data. The upper estimate adds a 20% negotiation premium, consistent with typical volume contract discounts.
Materials tableLists each material, total spend and volume, average price paid, best price paid, and estimated savings. Materials priced at ERP standard cost only are excluded from the savings total.
Material summariesNarrative paragraphs below the table give a one-paragraph read of each material's price trend and a brief recommendation.
The savings figures are floor estimates, not guarantees. They assume you could have bought everything at the lowest observed price in the period, which is not realistic in practice. Use them as a relative measure of which materials have the most pricing variation, not as a budget forecast.

3. Priority Actions

A ranked list of specific things to do before your next purchasing cycle

Priority Actions are the most important section. Each action is specific, executable, and ranked by the dollar value at stake. They come in three types:

Forward-buy

Prices are rising. Buy more than your normal cadence quantity now to lock in current pricing before the trend continues. The action tells you which supplier to contact and what to confirm before placing the order.

Hold back

Prices are falling. Buy a smaller batch than usual and defer heavier replenishment. The report tells you when to re-evaluate (typically at the next price signal).

Audit a PO

A specific purchase order was priced significantly above the period average. Contact the supplier, ask for a written explanation, and determine whether it was a legitimate market rate, an expedite charge, or a billing discrepancy.
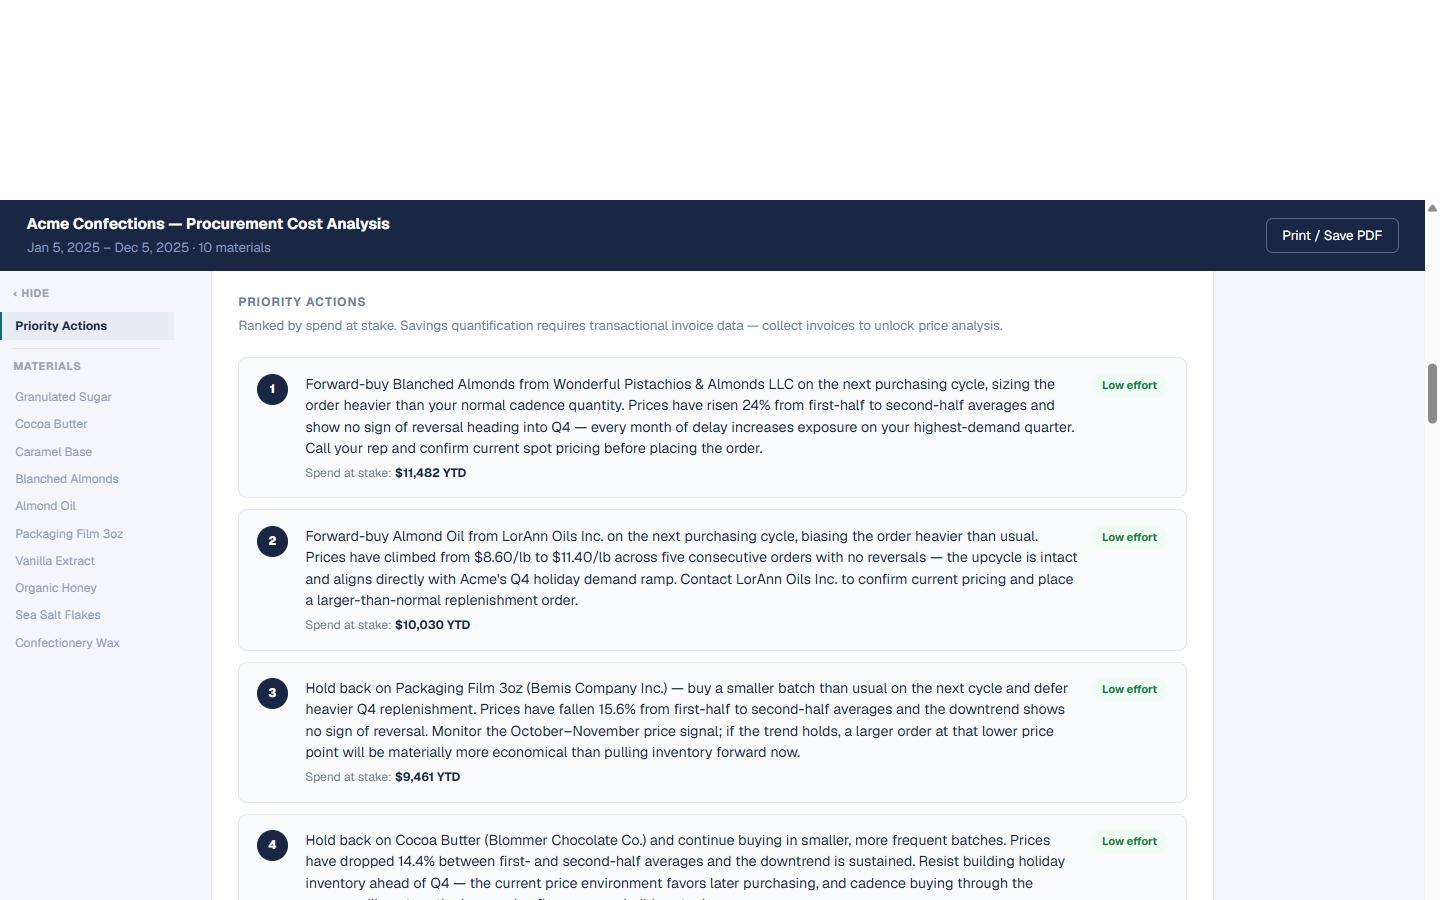
Priority Actions section showing ranked list of recommendations
Priority Actions are ranked by spend at stake. Each action names the material, supplier, and specific step to take.
Effort ratings are a guide, not a guarantee.“Low effort” means the action is a single email or call to your supplier: no contract negotiation, no switching costs. The hard part is deciding whether to act at all.

4. Material Cards

One card per material: trend, chart, and recommendation

After the Priority Actions, the report has a card for each material you submitted. Each card shows volume trend, key stats, a price/volume chart, and a detailed recommendation.

Volume trend badge

RisingFallingVolatileStable

The badge reflects the direction of the price trend over the audit period. Rising and falling are directional: the price moved consistently in one direction. Volatile means significant price swings with no clear trend. Stable means prices were flat or nearly flat.
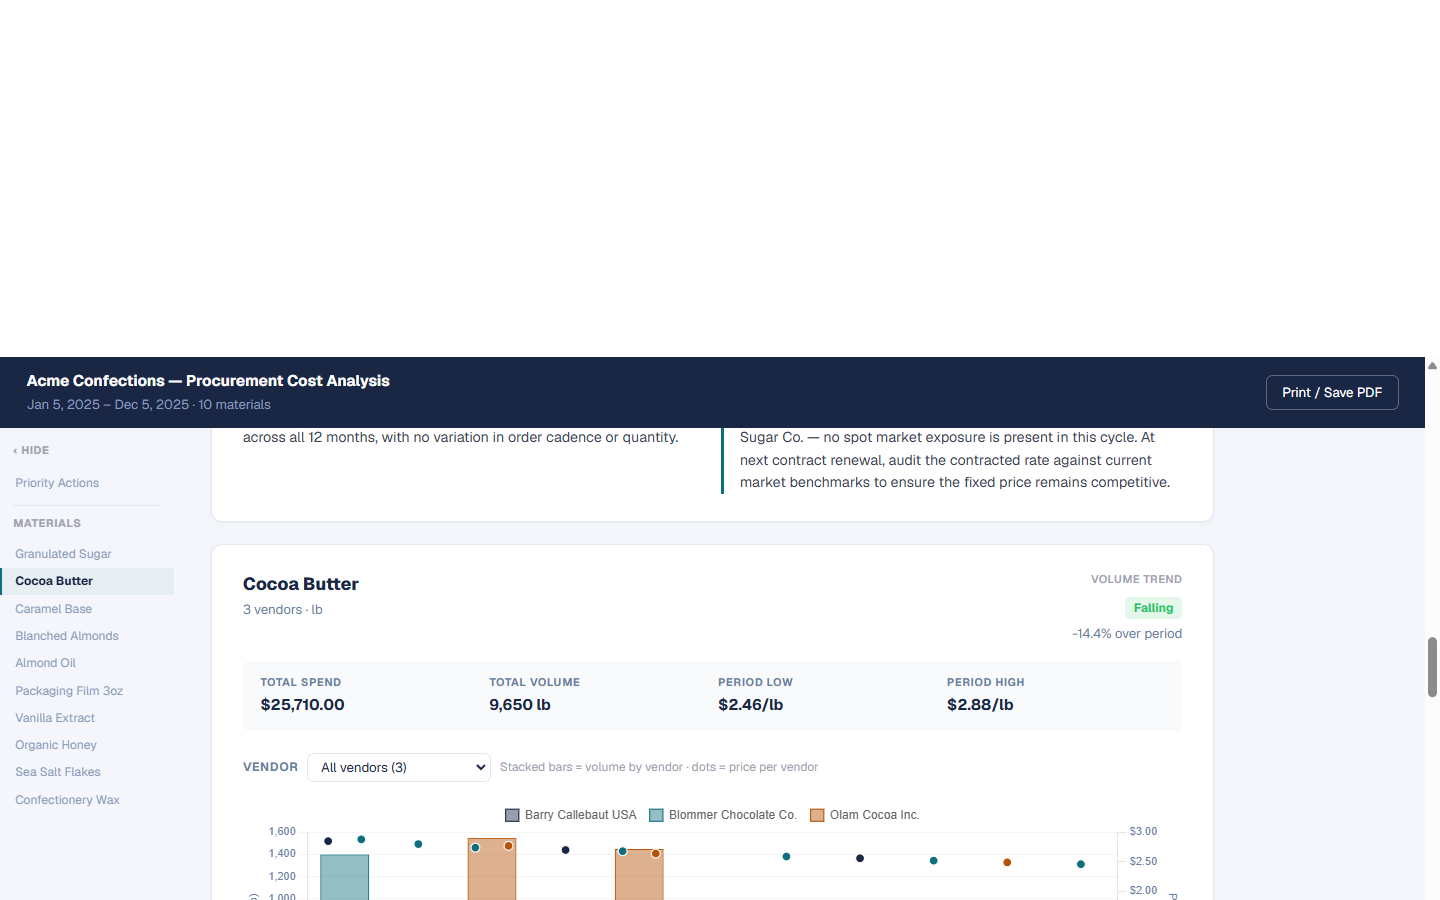
Cocoa Butter material card showing Falling trend, stats, and price chart
A Falling trend card: prices declined 14.4% over the period. The dual-axis chart shows volume (bars) and price per vendor (dots).
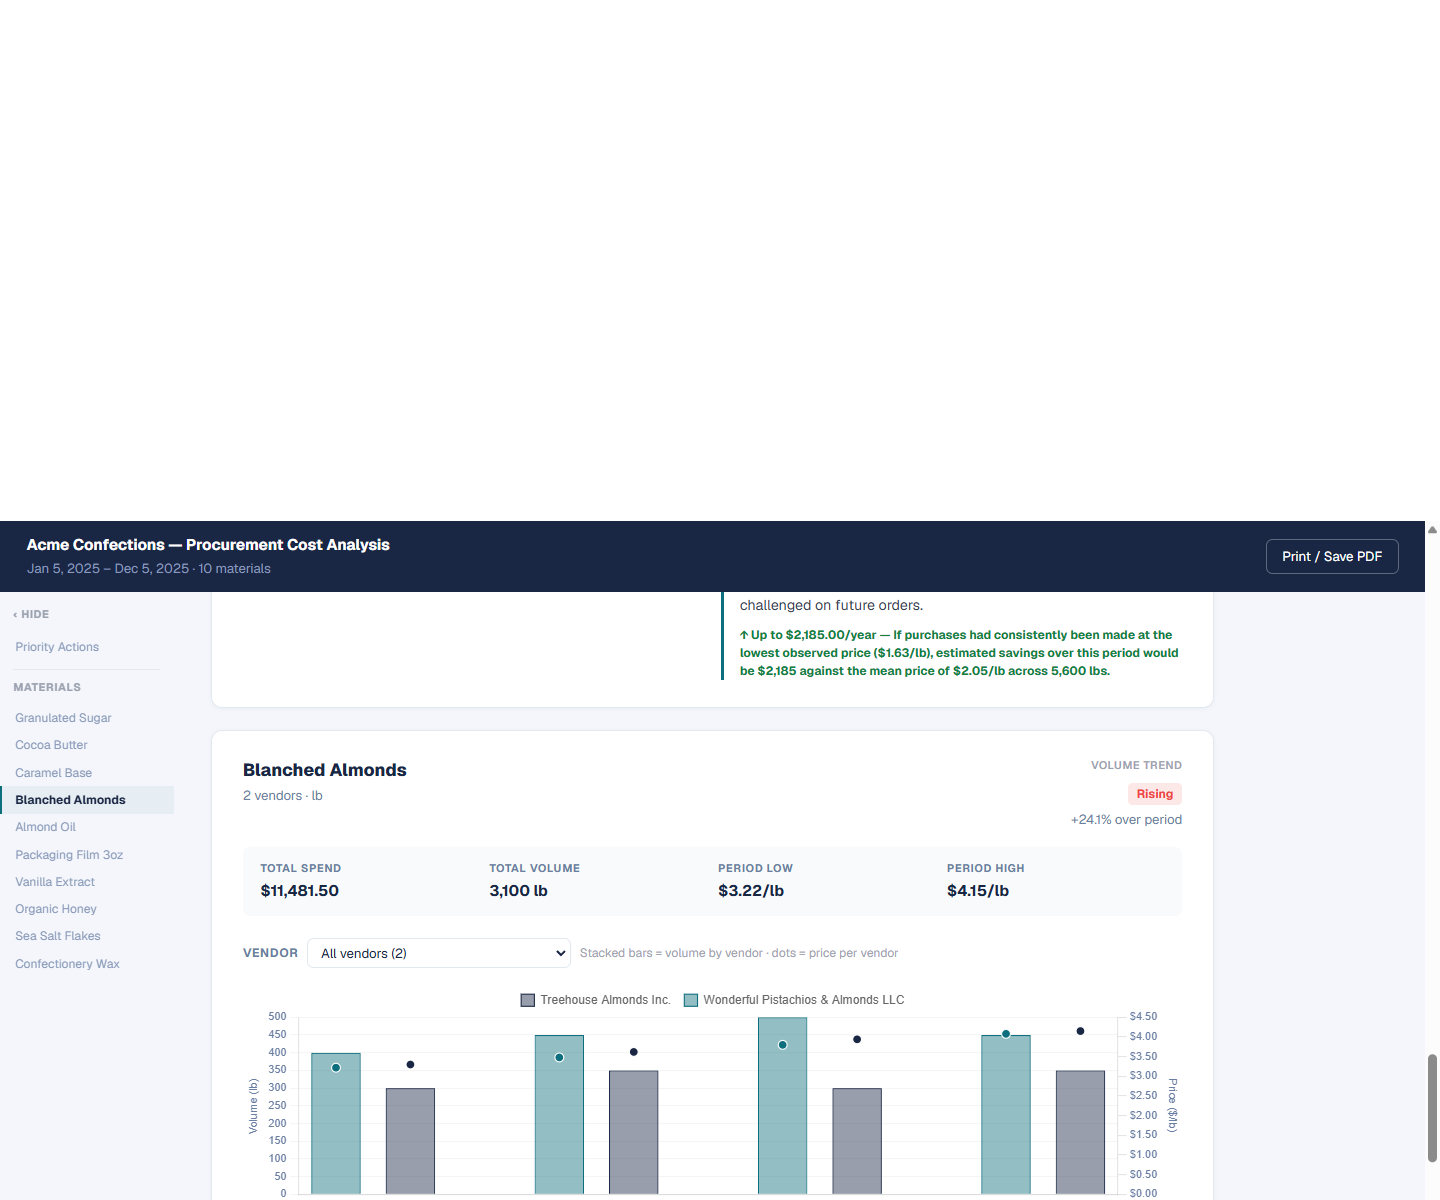
Blanched Almonds material card showing Rising trend, stats, and price chart
A Rising trend card: prices climbed 24% over the period, across two vendors. The forward-buy action is triggered by this trend.
Total SpendSum of all purchase orders for this material in the audit period.
Total VolumeTotal quantity purchased across all orders.
Period Low / HighLowest and highest unit price observed in any single purchase order.
Vendor selectorFor materials purchased from multiple vendors, use the dropdown to see the chart broken down by vendor. The all-vendors view stacks volume bars by vendor and plots each vendor's price as separate dots.
Transaction DetailExpandable table showing every purchase order in the period: date, vendor, quantity, unit price, and total.
Purchasing AnomaliesExpandable list of specific orders that were priced significantly above the period average. These are the source of the audit PO actions.
Materials showing “standard cost data only”are priced at a fixed ERP rate: your accounting system didn't capture the actual invoice price. No trend analysis is available for these materials. The recommendation is to collect supplier invoices on the next purchasing cycle so a real price audit is possible.

5. How savings are calculated

Every savings figure in the report is calculated the same way: it asks what your total spend would have been if every purchase had been made at the lowest price observed for that material during the audit period. That is the floor estimate.

The upper estimate in the Executive Brief adds a 20% negotiation premium on top of the floor; the idea being that in practice, a supplier negotiation might achieve prices below the floor by a further margin. The 20% is a general benchmark, not a guarantee.

Rising-price materials need different interpretation. When a material like almonds has been on a price uptrend, the savings figure reflects market exposure: the cost of the market moving against you, not a vendor negotiation gap. The report calls this out explicitly. A savings figure driven by a rising market should trigger a forward-buy, not a supplier negotiation.

The Assumptions & Notes section at the bottom of the report documents exactly how each figure was calculated, including which materials were included in the transactional floor and which were excluded because they only have standard cost data.

6. What to do next

The report is designed to drive a specific set of actions in the next 1–2 weeks. Work through the Priority Actions list in order:

  1. Forward-buy actions first: these are time-sensitive. If the trend is intact, every week of delay increases your exposure.
  2. Hold-back actions on your next normal order cycle: no rush, but don't build inventory before checking the price signal.
  3. PO audits within 30 days: the further you get from the purchase date, the harder it is to get a clear answer from the supplier.
  4. Collect invoices for standard-cost materials: this unlocks price analysis on those materials in a future engagement.
Questions about your report? If something looks wrong, is unclear, or you want to talk through a specific finding, reach out: info@poassembler.com
build 454ef0d